Tag: cycle routes

Second 40+ mile cycle of 2016

I am not long back in from my second 40+ mile cycle of 2016. Now really hoping, I can get my first 50+ mile cycle of the year done, before the month is out!

I will now leave you with the route map, elevation graph, route statistics and photos.

Route map:-

05-04-2016 - bike ride route map

Elevation graph:-

05-04-2016 - bike ride elevation graph

Route statistics:-

  • Start time: 1:02 pm.
  • Distance: 40.13 miles.
  • Time: 3:26:28 (h:m:s).
  • Elapsed Time: 5:04:52 (h:m:s).
  • Avg Speed: 11.7 mph.
  • Max Speed: 32.1 mph.
  • Elevation Gain: 395 meters.
  • Min Elevation: 33 meters.
  • Max Elevation: 99 meters.

Data from: Garmin Connect.

Photos:-

Amazing Spiderman 2 MorphsuitAmazing Spiderman 2 MorphsuitAmazing Spiderman 2 MorphsuitAmazing Spiderman 2 Morphsuit

First 40+ mile cycle of 2016!

I am so pleased! Did my first 40+ mile cycle of the year! In fact I did 42.25 miles. Which takes my monthly total up to 77.48 miles. Which is not bad for just 3 days into the month!

I also did some more geocaching during the cycle. I found another 6, which takes my total finds up to 240.

I will now leave you with the route map, elevation graph, route statistics and photos.

Route map:-

03-03-2016 - bike ride route map

Elevation graph:-

03-03-2016 - bike ride elevation graph

Route statistics:-

  • Start time: 11:40 am.
  • Distance: 42.25 miles.
  • Time: 3:44:11 (h:m:s).
  • Elapsed Time: 5:26:48 (h:m:s).
  • Avg Speed: 11.3 mph.
  • Max Speed: 33.2 mph.
  • Elevation Gain: 385 meters.
  • Min Elevation: 44 meters.
  • Max Elevation: 163 meters.

Data from: Garmin Connect.

Photos:-

dsc03631dsc03634dsc03637

Longest cycle of the year! 34 miles!

That’s well pleased! I’ve not long back in from the longest cycle of the year! I did 34.59 miles! My avg speed was not the best at only 10.6 mph. Still I am more than happy! Just myself and the bike need a good wash! After cycling to, then around Rutland Water!

During the cycle, I also did some more Geocaching. I found 9 during the cycle, which takes my total finds up to 207! So should make my goal of 250!

I will now leave you with the route map, elevation graph, route statistics and photos.

Route map:-

18-02-2016 - bike ride route

Elevation graph:-

18-02-2016 - bike ride elevation graph

Route statistics:-

  • Start time: 1:33 pm.
  • Distance: 34.59 miles – longest cycle of the year!
  • Time: 3:15:34 (h:m:s).
  • Elapsed Time: 5:01:03 (h:m:s) – stopped a hell of a lot for Geocaching.
  • Avg Speed: 10.6 mph.
  • Max Speed: 25.5 mph.
  • Elevation Gain: 299 meters.
  • Min Elevation: 51 meters.
  • Max Elevation: 142 meters.

Data from: Garmin Connect.

Photos:-

Rutland Water
Rutland Water
Rutland Water funny sign
Rutland Water

Good 20 mile cycle with some Geocaching

That’s me just done another good cycle, this time I did 20.89 miles. Which takes my monthly total to 166.6 miles. So in other words over double the number that I did in January of last year!

During the cycle, I also did some Geocaching. I found 3 during the cycle, which it more than in the last number of year put together!

I will now leave you with the route map, elevation graph, route statistics and photos.

Route map:-

28-01-2016 - bike ride route

Elevation graph:-

28-01-2016 - bike ride elevation graph

Route statistics:-

  • Start time: 1:56 pm.
  • Distance: 20.89 miles.
  • Time: 1:51:33 (h:m:s).
  • Elapsed Time: 2:38:29 (h:m:s).
  • Avg Speed: 11.2 mph.
  • Max Speed: 29 mph.
  • Elevation Gain: 223 meters.
  • Min Elevation: 55 meters.
  • Max Elevation: 100 meters.

Data from: Garmin Connect.

Photos:-

Out cyclingOut cycling

Another day, another cycle, but with photos!

Yet another cycle, but this time, I make sure I took lots of photos! Also can’t believe this time last week. I was out in my full winter gear. But a week on, I have my legs out!

I did 25.11 miles this afternoon. Which I am very pleased with! Takes my total for the month so far up to 145.7 miles.

I will now leave you with the route map, elevation graph, route statistics and photos.

Route map:-

25-01-2016 - bike ride route

Elevation graph:-

25-01-2016 - bike ride elevation graph

Route statistics:-

  • Start time: 12:55 pm.
  • Distance: 25.11 miles.
  • Time: 2:11:59 (h:m:s).
  • Elapsed Time: 3:40:00 (h:m:s).
  • Avg Speed: 11.4 mph.
  • Max Speed: 30.7 mph.
  • Elevation Gain: 298 meters.
  • Min Elevation: 46 meters.
  • Max Elevation: 99 meters.

Data from: Garmin Connect.

Photos:-
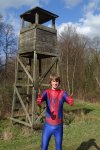
Wetsuit cyclingWetsuit cyclingWetsuit cyclingWetsuit cycling

Longest cycle of 2016 so far…

Well pleased with myself! Just done the longest cycle of the year so far! I did 26.79 miles. Still not the longest cycle in the world. But I am, still very pleased with that total.

It also takes my monthly total so far up to 120.6 miles. So I am already 40.3 miles up, on the same point last year.

I will now leave you with the route map, elevation graph and route statistics.

Route map:-

24-01-2016 - bike ride route map

Elevation graph:-

24-01-2016 - bike ride elevation graph

Route statistics:-

  • Start time: 2:17 pm.
  • Distance: 26.79 miles.
  • Time: 2:26:21 (h:m:s).
  • Elapsed Time: 2:57:22 (h:m:s).
  • Avg Speed: 11 mph.
  • Max Speed: 32.6 mph (best of 2016 so far).
  • Elevation Gain: 322 meters.
  • Min Elevation: 58 meters.
  • Max Elevation: 136 meters.

Data from: Garmin Connect.

Nice and easy 20 mile cycle

That was a nice and easy 20.08 mile cycle. Which takes my total up to 253.05 miles so far this month. So way behind on what I was hoping to get to, by this point :(.

I will now leave you with the route map, route statistics and photos. Sorry no elevation data, due to GPS playing up.

Route map:-

20-01-2014 bike ride

Route statistics:-

  • Start time: 1:11 pm.
  • Distance: 20.08 miles.
  • Time: 1:33:49 (h:m:s).
  • Elapsed Time: 1:52:37 (h:m:s).
  • Avg Speed: 12.8 mph.
  • Max Speed: 30.4 mph.

Data from: Garmin Connect.

Photos from the cycle:-


First 30+ mile cycle of 2014

That’s me just done my first 30+ mile cycle of the year. Which takes my total up to 300.1 miles so far this month. Already done 121.7 more miles, than I had done by this point last year! But still got 5,818.3 more miles to overtake last year’s record!

I will now leave you with the route map, elevation graph, route statistics and photos.

Route map:-

21-01-2014 bike ride

Elevation graph:-

21-01-2014 bike ride elevation graph

Route statistics:-

  • Start time: 12:09 pm.
  • Distance: 38.35 miles.
  • Time: 3:21:05 (h:m:s).
  • Elapsed Time: 4:19:06 (h:m:s).
  • Avg Speed: 11.4 mph.
  • Max Speed: 25.7 mph.
  • Elevation Gain: 543 meters.
  • Min Elevation: 31 meters.
  • Max Elevation: 164 meters.

Data from: Garmin Connect.

Photos from the cycle:-

DSC02696DSC02701DSC02705DSC02712DSC02714

Second 50+ mile cycle of 2014

That’s me just done my second 50+ mile cycle of the year. It was bit a bit less than my last 50 mile cycle. Not that a care at all. Just happy that I am already doing 50+ mile cycles :).

I will now leave you with the route map, elevation graph, route statistics and photos.

Route map:-

19-01-201 bike ride

Elevation graph:-

19-01-2014 bike ride elevation graph

Route statistics:-

  • Start time: 12:58 pm.
  • Distance: 50.33 miles.
  • Time: 4:26:40 (h:m:s).
  • Elapsed Time: 5:14:44 (h:m:s).
  • Avg Speed: 11.3 mph.
  • Max Speed: 26.5 mph.
  • Elevation Gain: 717 meters.
  • Min Elevation: 25 meters.
  • Max Elevation: 164 meters.

Data from: Garmin Connect.

Photos from the cycle:-

DSC02679DSC02680DSC02685DSC02686DSC02689

First 50 mile cycle of 2014

Well pleased with myself. Just done the first 50+ mile cycle of 2014. That also makes it the longest cycle I have ever done in any January :). Also I have ready done more so far this month, than I did in January last year.

Still got a hell of a lot of miles left to do, if I want to overtake last years record number of miles. Got 5939.5 miles left to do!!

I will now leave you with the route map, elevation graph, route statistics and photos.

Route map:-

16-01-2014 bike ride

Elevation graph:

16-01-2014 bike ride elevation graph

Route statistics:-

  • Start time: 12:21 pm.
  • Distance: 51.15 miles.
  • Time: 4:30:30 (h:m:s).
  • Elapsed Time: 5:34:36 (h:m:s).
  • Avg Speed: 11.3 mph.
  • Max Speed: 30.4 mph.
  • Elevation Gain: 727 meters.
  • Min Elevation: 31 meters.
  • Max Elevation: 156 meters.

Data from: Garmin Connect.

Photos from the cycle:-

DSC02635DSC02638DSC02654
DSC02666DSC02674DSC02670