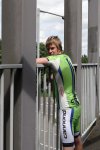
Category: cycle route

First 50+ mile cycle of 2016!

At long last, I’ve just done the first 50+ mile cycle of the year! Let’s hope it’s the first of many! Also really hoping, I do at least one 100 mile cycle this year! Not done one of them, in a number of years!

I will now leave you with the route map, elevation graph and route statistics.

Route map:-

24-05-2016 - bike ride route map

Elevation graph:-

24-05-2016 - bike ride elevation graph

Route statistics:-

  • Start time: 11:30 am.
  • Distance: 53.51 miles.
  • Time: 3:58:07 (h:m:s).
  • Elapsed Time: 4:39:28 (h:m:s).
  • Avg Speed: 13.5 mph.
  • Max Speed: 31.9 mph.
  • Elevation Gain: 485 meters.
  • Min Elevation: 10 meters.
  • Max Elevation: 164 meters.

Data from: Garmin Connect.

Longest cycle on the new bike…

That’s me not long back in from doing the longest cycle on the bike so far! I did 36.45 miles! I would have liked to have done over 40 miles! But all the rain, wind and even the hail was starting to do my head in! It’s feeling more like February, than late April! I am normally out in my shorts by now! It’s still way, way to cold for that!!

I will now leave you with the route map, elevation graph, route statistics and photos.

Route map:-

26-04-2016 - bike ride route map

Elevation graph:-

26-04-2016 - bike ride elevation graph

Route statistics:-

  • Start time: 1:00 pm.
  • Distance: 36.45 miles.
  • Time: 2:56:06 (h:m:s).
  • Elapsed Time: 3:20:30 (h:m:s).
  • Avg Speed: 12.4 mph.
  • Max Speed: 31.4 mph.
  • Elevation Gain: 339 meters.
  • Min Elevation: 10 meters.
  • Max Elevation: 88 meters.

Data from: Garmin Connect.

Photos:-

Specialized Crosstrail Sport Disc '16
Specialized Crosstrail Sport Disc ’16

Second 40+ mile cycle of 2016

I am not long back in from my second 40+ mile cycle of 2016. Now really hoping, I can get my first 50+ mile cycle of the year done, before the month is out!

I will now leave you with the route map, elevation graph, route statistics and photos.

Route map:-

05-04-2016 - bike ride route map

Elevation graph:-

05-04-2016 - bike ride elevation graph

Route statistics:-

  • Start time: 1:02 pm.
  • Distance: 40.13 miles.
  • Time: 3:26:28 (h:m:s).
  • Elapsed Time: 5:04:52 (h:m:s).
  • Avg Speed: 11.7 mph.
  • Max Speed: 32.1 mph.
  • Elevation Gain: 395 meters.
  • Min Elevation: 33 meters.
  • Max Elevation: 99 meters.

Data from: Garmin Connect.

Photos:-

Amazing Spiderman 2 MorphsuitAmazing Spiderman 2 MorphsuitAmazing Spiderman 2 MorphsuitAmazing Spiderman 2 Morphsuit

First 40+ mile cycle of 2016!

I am so pleased! Did my first 40+ mile cycle of the year! In fact I did 42.25 miles. Which takes my monthly total up to 77.48 miles. Which is not bad for just 3 days into the month!

I also did some more geocaching during the cycle. I found another 6, which takes my total finds up to 240.

I will now leave you with the route map, elevation graph, route statistics and photos.

Route map:-

03-03-2016 - bike ride route map

Elevation graph:-

03-03-2016 - bike ride elevation graph

Route statistics:-

  • Start time: 11:40 am.
  • Distance: 42.25 miles.
  • Time: 3:44:11 (h:m:s).
  • Elapsed Time: 5:26:48 (h:m:s).
  • Avg Speed: 11.3 mph.
  • Max Speed: 33.2 mph.
  • Elevation Gain: 385 meters.
  • Min Elevation: 44 meters.
  • Max Elevation: 163 meters.

Data from: Garmin Connect.

Photos:-

dsc03631dsc03634dsc03637

Good 20 mile cycle with some Geocaching

That’s me just done another good cycle, this time I did 20.89 miles. Which takes my monthly total to 166.6 miles. So in other words over double the number that I did in January of last year!

During the cycle, I also did some Geocaching. I found 3 during the cycle, which it more than in the last number of year put together!

I will now leave you with the route map, elevation graph, route statistics and photos.

Route map:-

28-01-2016 - bike ride route

Elevation graph:-

28-01-2016 - bike ride elevation graph

Route statistics:-

  • Start time: 1:56 pm.
  • Distance: 20.89 miles.
  • Time: 1:51:33 (h:m:s).
  • Elapsed Time: 2:38:29 (h:m:s).
  • Avg Speed: 11.2 mph.
  • Max Speed: 29 mph.
  • Elevation Gain: 223 meters.
  • Min Elevation: 55 meters.
  • Max Elevation: 100 meters.

Data from: Garmin Connect.

Photos:-

Out cyclingOut cycling

Another day, another cycle, but with photos!

Yet another cycle, but this time, I make sure I took lots of photos! Also can’t believe this time last week. I was out in my full winter gear. But a week on, I have my legs out!

I did 25.11 miles this afternoon. Which I am very pleased with! Takes my total for the month so far up to 145.7 miles.

I will now leave you with the route map, elevation graph, route statistics and photos.

Route map:-

25-01-2016 - bike ride route

Elevation graph:-

25-01-2016 - bike ride elevation graph

Route statistics:-

  • Start time: 12:55 pm.
  • Distance: 25.11 miles.
  • Time: 2:11:59 (h:m:s).
  • Elapsed Time: 3:40:00 (h:m:s).
  • Avg Speed: 11.4 mph.
  • Max Speed: 30.7 mph.
  • Elevation Gain: 298 meters.
  • Min Elevation: 46 meters.
  • Max Elevation: 99 meters.

Data from: Garmin Connect.

Photos:-

Wetsuit cyclingWetsuit cyclingWetsuit cyclingWetsuit cycling

Second cycle of 2016!

That’s me now done two cycles so far this year. I only did 13.46 miles this afternoon, so still a very short cycle. But at least my average and maximum speeds were a bit better during this cycle!

I will now leave you with the route map and route statistics.

Route map:-

13-01-2016 - bike ride route map

Route statistics:-

  • Start time: 2:15 pm.
  • Distance: 13.46 miles.
  • Time: 1:14:06 (h:m:s).
  • Elapsed Time: 1:35:51 (h:m:s).
  • Avg Speed: 10.9 mph (a wee bit better!).
  • Max Speed: 31.7 mph (that’s more like it!).
  • Elevation Gain: 144 meters.
  • Min Elevation: 55 meters.
  • Max Elevation: 95 meters.

Data from: Garmin Connect.

First cycle of 2016!

That’s me just done the first cycle of 2016! I only did 20.7 miles. Not the longest cycle in the end, but it’s a good start!

I will now leave you with the route map and route statistics.

Route map:-

12-01-2016 - bike ride route map

Route statistics:-

  • Start time: 2:27 pm.
  • Distance: 20.73 miles.
  • Time: 2:04:27 (h:m:s).
  • Elapsed Time: 2:15:05 (h:m:s).
  • Avg Speed: 10 mph (very slow indeed).
  • Max Speed: 25.9 mph.
  • Elevation Gain: 224 meters.
  • Min Elevation: 39 meters.
  • Max Elevation: 95 meters.

Data from: Garmin Connect.

02-Jul-2015: First cycle of the month!

I was hoping to get out yesterday for a cycle. But had to wait till today! Yesterday the temperature in my part of the UK got up to 35C, which if you ask me, is just way to hot for cycling in!

So today, I did 34.10 miles on the bike. Which I am more than happy with! But this month cycling wise is going to be hard work! Since in July of last year, I did 705.2 miles! I need to get a hell of a lot of miles in this month!!

I will now leave you with the route map, route statistics and photos.

Route map:-

02-07-2015 - bike ride route map

Elevation graph:-

02-07-2015 - bike ride elevation graph

Route statistics:-

  • Start time: 2:33 pm.
  • Distance: 34.10 miles.
  • Time: 2:43:23 (h:m:s).
  • Elapsed Time: 3:34:15 (h:m:s).
  • Avg Speed: 12.5 mph.
  • Max Speed: 35 mph.
  • Elevation Gain: 318 meters.
  • Min Elevation: 55 meters.
  • Max Elevation: 155 meters.

Data from: Garmin Connect.

Photos from the cycle:-

dsc00463dsc00468dsc00471

29-Jun-2015: That was a good 30 mile cycle!

That was a good cycle! Even found a new road, I’ve always past and never noticed it before! I only did 30 miles, I was hoping to do more. But had to get back to pick a mate up from the train station.

So far this year, I’ve only done 1,056.8 miles. By this time last year, it was 2,730.5. So I am 1,673.7 miles down! On the same point last year! Can’t see me making them number of miles up, before the end of the year! 🙁

I will now leave you with the route map, route statistics and photos.

Route map:-

29-06-2015 - bike ride route map

Elevation graph:-

29-06-2015 - bike ride elevation graph

Route statistics:-

  • Start time: 12:59 pm.
  • Distance: 30.45 miles.
  • Time: 2:25:02 (h:m:s).
  • Elapsed Time: 3:16:44 (h:m:s).
  • Avg Speed: 12.6 mph.
  • Max Speed: 38.7 mph.
  • Elevation Gain: 320 meters.
  • Min Elevation: 55 meters.
  • Max Elevation: 136 meters.

Data from: Garmin Connect.

Photos from the cycle:-

Cannondale Pro Cycling Team 2014Cannondale Pro Cycling Team 2014Cannondale Pro Cycling Team 2014Cannondale Pro Cycling Team 2014Cannondale Pro Cycling Team 2014