Tonight at the dog track, Jason that I have been working with for the last 3 years. Found out what happens on your last night at work. That’s going in a sink full of ice and water!
Vlog: Wetsuit cycling with motorcycle helmet
Speaking about cycling in a wetsuit and a motorcycle helmet. It was very, very wet so just had to be done.
Vlog: Going down slide
Going fast down a slide, while wearing a motorcycle helmet.
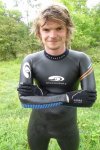
First wetsuit cycle since May 2012
Since it had been pissing it down all day, I made up my mind to make the most of it. So I put on my blueseventy axium wetsuit and went out a cycle. Below are some photos I took during the cycle :).
More photos from the set can be found at www.gordon-valentine.com/zenphoto/me/2012/page/11
Cycling around Rutland Water with friends
Today I had great fun cycling to then around Rutland Water. So a total of 45.60 by the time I got back home. When I got to Rutland Water, I met up with Tristan and his boyfriend Dave. I have known Tristan for year, but not seen him in many years. First time ever meeting his other half. So I then did the Rutland Water section with them both. It was so much fun, hope we can all find the time to do it again at some point :).
I now only have 10.6 miles to go and I will have done the second most ever miles in a single year. Then I only have last years record of 5,066 miles to beat. Can’t see me doing that, since I have to find the time to do another 1,000 miles before the year is out.
I will now leave you with the route map, elevation graph, route statistics and photos.
Route map:-

Elevation graph:–

Route statistics:-
- Distance: 45.60 miles
- Time: 3:43:27 (h:m:s)
- Avg Speed: 12.2 mph
- Max Speed: 31.6 mph
- Elevation Gain: 387 meters
- Min Elevation: 43 meters
- Max Elevation: 128 meters
Data from: Garmin Connect.
Photos from the cycle:-
Photos from today’s mini 35 mile cycle
Here are some photos from today’s mini 35.24 mile cycle.
Route statistics:-
- Distance: 35.24 miles
- Time: 2:51:17 (h:m:s)
- Avg Speed: 12.3 mph
- Max Speed: 34 mph
- Elevation Gain: 346 meters
- Min Elevation: 43 meters
- Max Elevation: 128 meters
Data from: Garmin Connect.
Posting comments with Twitter, or Facebook accounts
 I have just updated this website, so you can now post comments using your WordPress.com, Twitter, or Facebook accounts.
Vlog: Second ever 100 mile cycle
Speaking about my only my second ever 100 mile cycle. That I did two days ago.
Nalini HTC Columbia Team kit photos
Second ever 100 mile bike ride
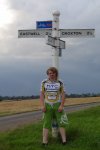
I am so pleased with myself. I have just done, my second 100+ mile cycle ever!! The last time I did 100+ miles was back in September last year. Check out the post: First ever 100 mile bike ride to see the route I took then.
Lucky I planned the route in my head this time. So did not have to mini cycle around my village to get the miles up. Also really liked this road, covered lots of new roads. So glad I had a OS map with me, to stop myself from getting lost.
I will now leave you with the route map, elevation graph, route statistics and photos.

The dark blue section of the route, shows new roads I covered during the cycle.
Elevation graph:

Route statistics:-
- Distance: 101.61 miles
- Time: 8:01:12 (h:m:s)
- Avg Speed: 12.7 mph
- Max Speed: 30.1 mph
- Elevation Gain: 882 meters
- Min Elevation: 4 meters
- Max Elevation: 179 meters
Data from: Garmin Connect — connect.garmin.com/modern/activity/213419058.
Photos from the cycle:-


